

Learning assessments have long been about numbers. Grades are numbers, after all, that indicate student performance. Unfortunately, our ability to quantify has been limited mostly to marked items such as assignments, projects, and tests. While one could also measure attendance as an indicator of participation, it was difficult to evaluate the extent to which students were engaging with class material. When you handed out a syllabus at the first class, for example, it was impossible to know how many students read it and how many simply filed it in the trash bin.
Modern learning management systems (LMS) allow instructors to quantify these interactions. One of the lesser-known features of D2L is the report tool that identifies which resources are being used, how frequently, and by whom. I will illustrate this feature below using examples taken from a large class I taught in the fall term of 2015. Student names, where they appear, have been anonymized with black bars.
Accessing content reports
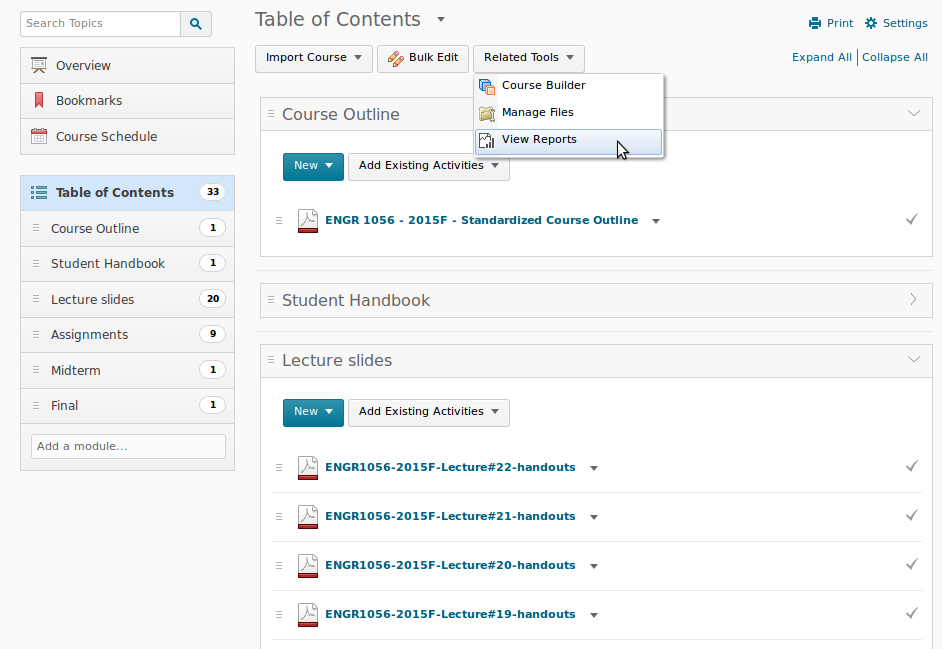
As shown in the screenshot below, you can access the usage information under “Related Tools->View Reports.” Please note that these commands are only available on the uppermost content level (“Table of Contents”). If you have selected any module or sub-module, the menus will be slightly different and will not include the “Related Tools” option.
Usage by content
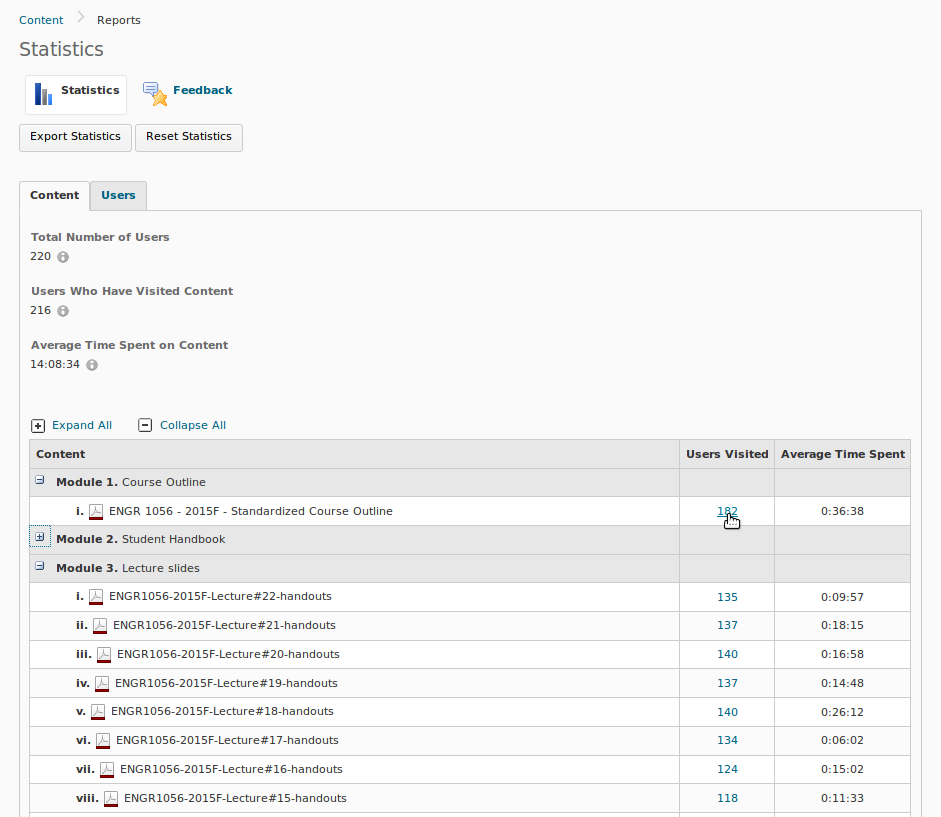
There are two ways to evaluate usage —by content or by users— as selected via the two tabs. By default you are presented with a table of content items. One column indicates how many students have accessed that content at least once, and a second reports the average time of engagement.
This basic information allows us to answer questions like: “How many students have read the syllabus?” The report tells us that 182 of 220 (or almost 83%) have done so. This result is consistent with my other classes where values range from about 75–90%.
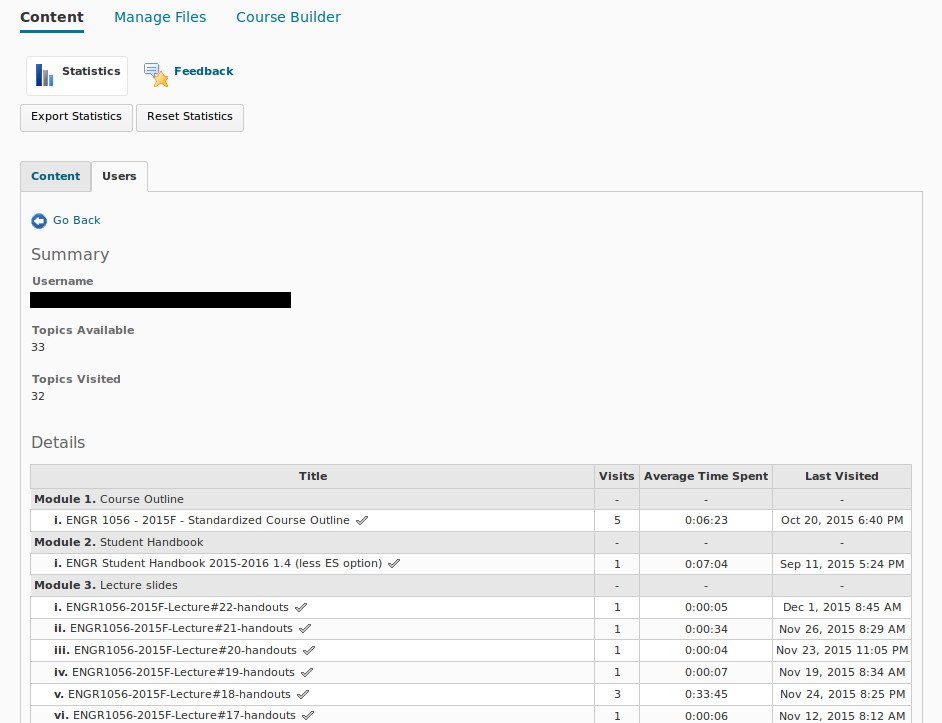
Clicking on the number of visitors for a particular content item opens a class list summarizing each student’s interaction data for that item. As shown below, some students make repeated reference to the course outline.
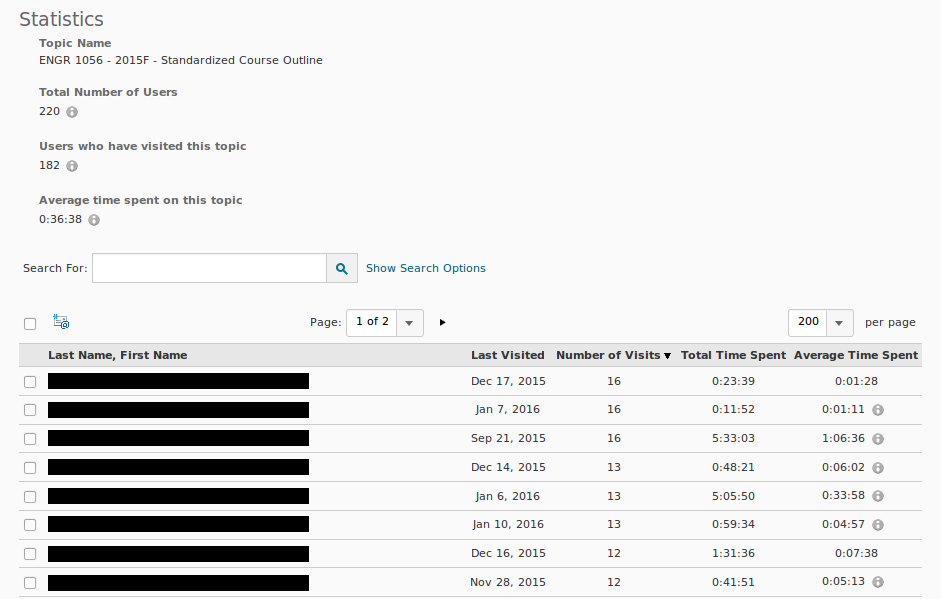
The limitations of this data are worth noting. I cannot imagine that even the most diligent student would devote over five hours to read and re-read a three page course outline, even when spread over multiple visits; yet two of the students in the screenshot have done so. Presumably an open browser window or tab continues to accumulate time even if the user is not actively interacting with the content. Regardless, the time of usage likely overestimates the actual amount. A second issue is that some students may choose to download and use content off-line. None of that interaction, save for the initial download, will be tracked by D2L.
Usage by student
Selecting the “Users” rather than the “Content” tab brings up a class list summarizing each student’s total engagement across all content. In reviewing these lists it becomes obvious that certain students’ interactions with the course content (e.g., 4 and 7 topics visited) lagged far behind others.
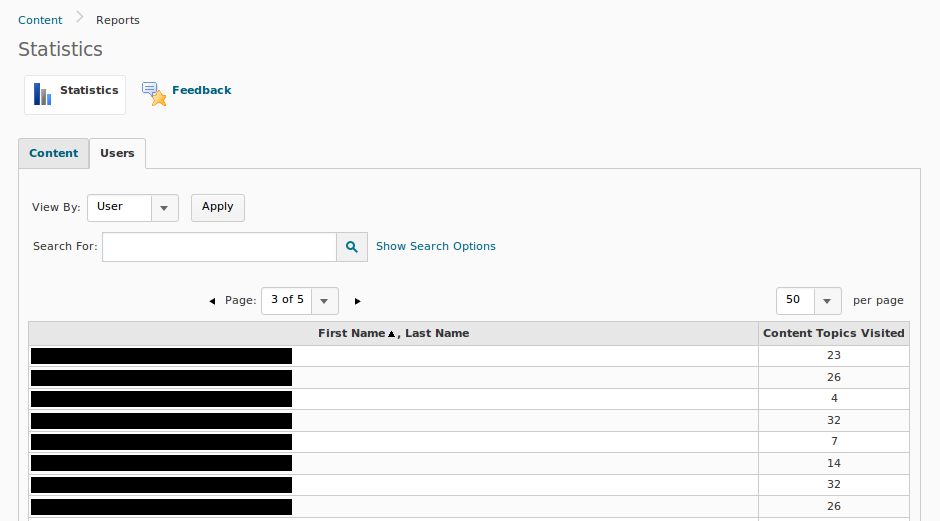
Selecting the name of an individual student allows the instructor to access a breakdown of their personal usage patterns.
How is this helpful?
Some software “features” can feel gimmicky and of questionable practical value; however, I see two important uses for this data:
- Assessing student engagement: While the use information is imperfect, it provides a relative indication of an individual’s engagement in the course. I rely heavily on D2L for most of my classes. If a student has not accessed any material after the few weeks, I can use that information as a prompt to discuss the situation with them.
- Assessing content effectiveness: A second application is in evaluating the usefulness of content itself. For example, for one class I prepared a few explanatory videos covering aspects of the course material. While they were time consuming to prepare, I though they would be a useful student resource for understanding material that had to be covered quickly in class. I decided to review the data after the first few videos; less than a third of the class had watched even one. Therefore, I decided to stop creating videos in order to free up time for more worthwhile activities.
Conclusion
One of the little-known benefits of a learning management system (LMS) like D2L is the ability to track student engagement with course content. The data is, admittedly, imperfect and must be interpreted with caution. Nevertheless, it can help us tailor our content to increase student interaction as well as identify students who might be struggling or disengaged.