

Image by ccarlstead via flickr (CC BY-NC-ND 2.0)
Not surprisingly, proper planning is also an important aspect of effective engineering management. Any project consists of a number of tasks that must be identified, organized, and scheduled in order to complete it on time and on budget. Consider building a house. Some of the many tasks that must be completed include laying a foundation, framing the house, wiring, plumbing, shingling the roof, and hanging drywall. While certain steps can be done concurrently, others must be done in a particular order. For example, the wiring cannot be installed until the framing is completed, and the framing requires that the foundation be ready. Proper project planning understands all the steps that are required, how long those steps should take, as well as any interdependencies, in order to schedule them most efficiently.
A mental schedule may be sufficient for simple projects; however, more complicated ones require a more rigorous planning process. An American engineer named Henry Gantt developed a technique to visualize the timing and interdependencies of a project’s tasks and sub-tasks in the early twentieth-century.[2] Since then the Gantt chart, as his creation came to be known, has become ubiquitous in the field of project management. Therefore, it is important to be familiar with the core features of this tool as well as some of the variations that have emerged over the last hundred years.
Core features of the Gantt chart
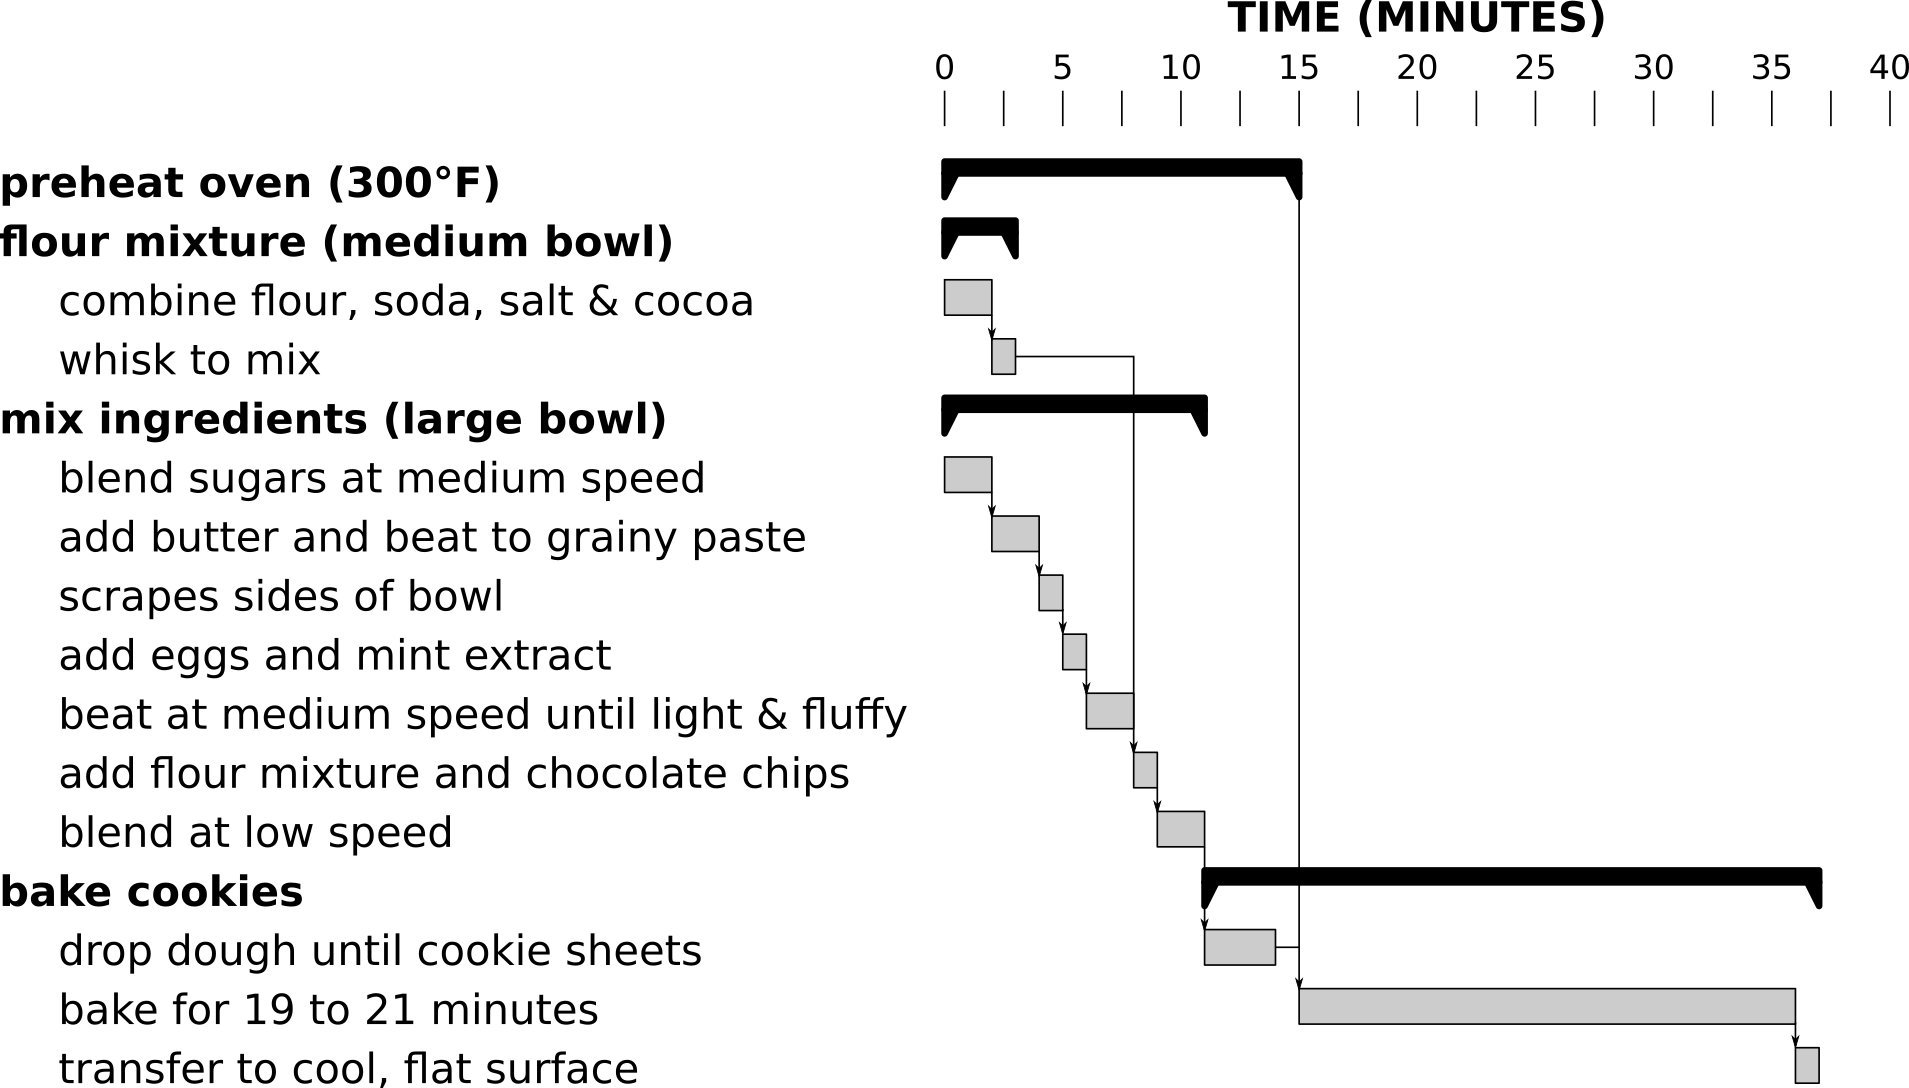
A simple Gantt is shown below which outlines the steps in my favorite chocolate mint cookie recipe.[3] While this is not the typical use-case, it illustrates the fundamental features of a Gantt chart: tasks, timing, and dependencies. Each of these three features is discussed briefly below.
Tasks
The most important feature of the Gantt chart is the list of tasks. Forcing oneself to list all the steps and sub-steps required to complete a project is a very helpful planning step. For our cookie example, the recipe instructions have been grouped into four main steps: preheating the oven, preparing the flour mixture, mixing the ingredients, and baking the cookies. Some of these tasks consist of multiple, smaller steps that must be completed.
One challenge when creating your task list is achieving the right level of detail. With enough patience, one could easily break down any one task into a near-infinite number of sub-tasks. The act of putting flour into a bowl, for example, could be described in painful detail: open drawer, remove measuring cup, place cup on counter, open cupboard, remove bag of all-purpose flour, place bag on counter, open bag of flour, and so on. Finding the proper balance of specificity and abstraction is critical. An overly detailed Gantt chart will quickly become unreadable; however, sufficient detail is needed to produce a useful planning tool.
Timing
A horizontal scale along the top of the Gantt chart indicates how much time has been scheduled to complete the project and individual tasks. The time scale in our cookie example is shown in minutes; however, days, weeks, or months are normally used depending on the size of the project.
Estimating the time required to complete a task can be a challenge. Nevertheless, the success of the overall schedule will depend on the ability to predict those values accurately.
Dependencies
Some steps cannot begin until earlier ones have been completed. For example, you must put the dough onto the cookie sheet before placing the sheet in the oven. We refer to these relationships as dependencies.
Typically, dependencies are shown as arrows or lines that connect one or more earlier tasks to later ones. The lines serve to emphasize the relationships between tasks. These lines may sometimes be omitted in simple charts and instead alignment of the start-end times is used to imply dependency in adjacent tasks. A simple Gantt chart is shown in the next section where the dependencies are implied.
Other variations
In addition to these three fundamental features, there are various other ways of encoding further formation into a Gantt chart. For example, a vertical line is often used to indicate the current date. Task bars may be shaded to indicate the amount of progress that has been made. Also, other symbols may be used to indicate the timing of various milestones or deliverables.
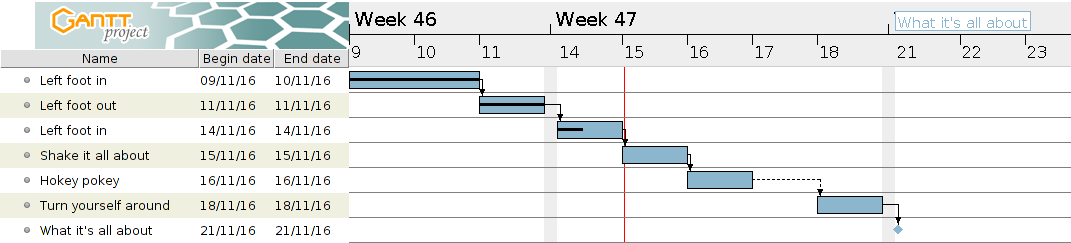
Here is an example chart created with GanttProject. The current date is indicated with a horizontal red line. Note how the black horizontal bars, which indicate progress for each task, show that the project is already behind schedule.
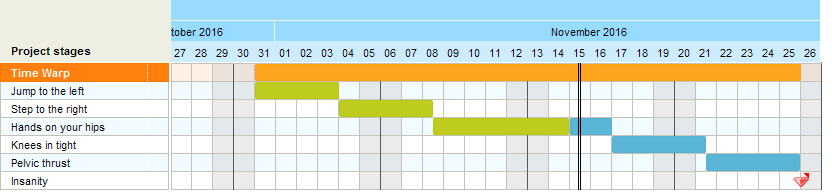
Below is an example of a simpler Gantt chart created using Tom’s Planner. The dependencies are implied rather than shown explicitly and colour is used to indicate progress instead of black bars.
Creating Gantt charts
There are a number of tools that can help with project management generally, and Gantt charts in particular, such as Microsoft Project, ProjectLibre, or GanttProject. A number of websites also offer Gantt creation services such as Gantter or Tom’s Planner.
Of course, you don’t need specialized software to make a Gantt chart. They can be drawn by hand or created in a spreadsheet like Excel. The chocolate mint cookie example shown earlier was made in Inkscape, a vector drawing package. However, task-specific tools will make it easier to update and modify the chart as a project progresses.
Limitations of Gantt charts
Despite their ubiquity, Gantt charts are not without their limitations.[4] Some of the deficiencies that have been identified include:
- Sparseness: There tends to be a lot of empty space in Gantt charts; that is, they have low data-density. Therefore, for non-trivial projects, a Gantt chart can become unusably large and can no longer be visualized in a legible form on a single screen or sheet of paper.
- Complexity: A related criticism is that Gantt charts do not do well with particularly complex projects. Multiple dependencies between tasks, for example, can be difficult to visualize and interpret. Size is again an issue.
- Missing information: A Gantt chart is designed to display certain kinds of information (tasks, times, and dependencies). But there are other types of information that is relevant to managing a project —the resources required, cost, effort— that are not represented. Other planning tools must also be used to monitor these details.
- Updating: One final deficiency is the challenge of keeping a Gantt chart updated. This limitation was more significant in the days of manually-created charts; software simplifies the process. Even so, the continued usefulness of the Gantt chart during a project requires that it be kept updated.
While some of these limitations are shared by other project management tools, it is helpful to keep them in mind to ensure that the Gantt chart is not misapplied.
Conclusion
Even after 100 years, Gantt charts remain a common tool for project management. Every engineer should be familiar with how to read, interpret, or create one. Nevertheless, it is important to remember the limitations of the Gantt chart so that it can be complemented with other planning tools.
Notes
- ^ Judd, H. Stanley. Think Rich: This 9-Day Money Management Program Will Help You Win the Money Game”, Delacorte Press: New York; 1978. ISBN: 0-4400-8732-5
- ^ Some credit Polish engineer Karol Adamiecki as the first person to use bar charts as a scheduling tool. He called his creation a harmonogram. Gantt, who seems to have developed his own charts independently, popularized the use of these tools in the West.
- ^ “Chocolate Mint Cookies.” Mrs. Fields Best Ever Cookie Book! Time-Life Books: Alexandria, VA; 1998. ISBN: 0-7370-0043-0
- ^ For a length discussion of Gantt charts, see the thread title “Project Management Graphics (or Gantt Charts)” on Edward Tufte’s website: http://www.edwardtufte.com/bboard/q-and-a-fetch-msg?msg_id=000076