

Image by Ruth Hartnup via flickr (CC-BY 2.0)
Engineering decisions also frequently involve evaluating multiple criteria to select the best alternative. Stuart Pugh (rhymes with hue), an English engineer, developed a technique to help make such decisions in an objective manner. It consists of a matrix representation of the alternatives being considered, the criteria being used to evaluate the alternatives, and the relative scores of the alternatives for each criterion.
We will illustrate the power of the Pugh Matrix (also known as a Decision Matrix) by tackling a question with which I often struggle: what donut[1] do I want to eat? Because I work at a Canadian University, there are two Tim Hortons within a 2 minute walk from my office. I often find myself wandering by one of the locations in the afternoon looking for a snack or baked good. As can be seen in the nutritional information shown below, Tim Hortons carries both snacks and baked goods! But which one to choose?
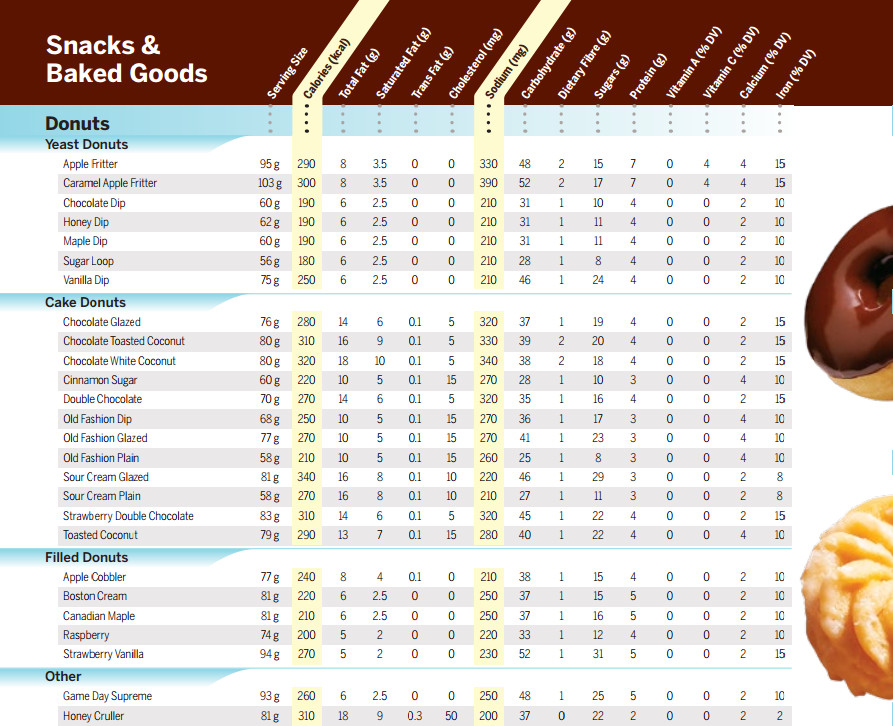
Portion of the Tim Horton’s nutritional guide (PDF).
Step 1: Identifying alternatives
The 26 donuts listed in the nutrition guide are too many to consider. Let’s assume, based on availability and preference, that I’ve narrowed the choices down to four possibilities: a chocolate dip, a honey cruller, a Boston cream, or an apple fritter.
One option in a Pugh matrix is typically used as the baseline to which all others are compared. If you are seeking to replace or upgrade an existing system, it makes sense to use the status quo as your baseline. If not, you can arbitrarily select one option as the reference against which the others will be evaluated. The latter is the situation we face in selecting a donut; we will simply choose the chocolate dip as the baseline.
Step 2: Identifying evaluation criteria
We will make use of the published nutritional information for these donuts as the basis for making our final selection.[2] The Tim Hortons website has a Meal Builder function which allows us to more easily compare our four candidate donuts (see below). For convenience, we will include only a subset of the nutritional parameters in our analysis: serving size, calories, fat, and protein. We will also include cost.
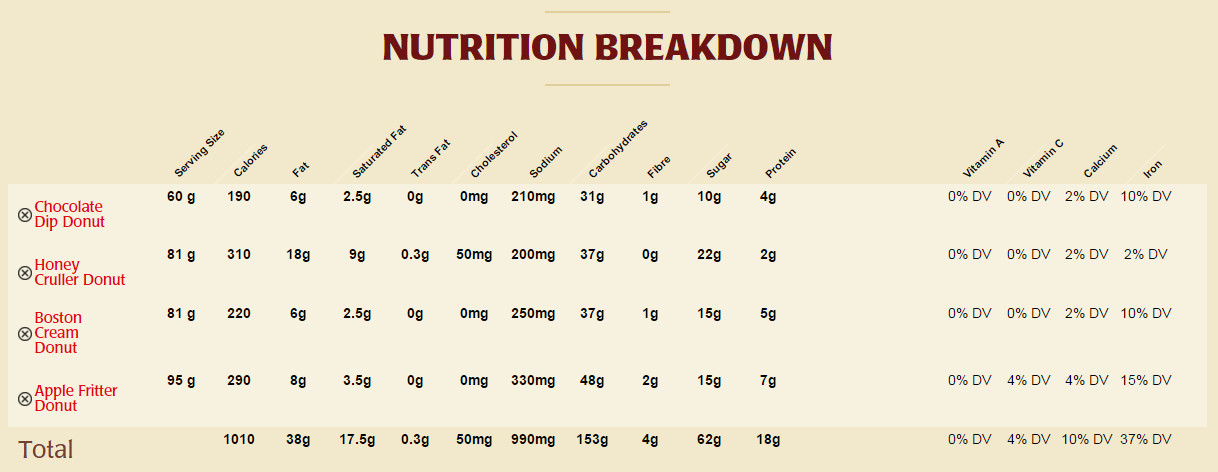
Nutrition information for the four selected donuts from the Meal Builder on the Tim Horton’s website.
Step 3: Determine criteria weights
| Criteria | Weight |
|---|---|
| Cost | 3 |
| Serving size | 2 |
| Calories | 1 |
| Fat | 1 |
| Protein | 1 |
Not all criteria are equally important. We will use a variant of the Pugh Matrix that incorporates weighting factors to account for the relative importance placed on each criterion.
Let’s stratify our evaluation criteria on a scale of one (least important) to three (most important). Since I am pretty cheap —although I prefer the term “financially prudent”— we will give cost the highest weight for the purposes of this example. Because this is a snack, and because I want it to be filling, serving size will be given the intermediate weight. The remaining nutritional considerations (calories, fat, protein) receive the lowest of priority.
Step 4: Establish a scoring system
Scoring for each criteria is not performed in an absolute sense but relative to the baseline option (the chocolate dip). An alternative is assigned a positive score when it is superior to the baseline, a zero when it is equivalent, and a negative score when it is inferior to the baseline.
There are a number of scoring approaches that can be adopted. We will use the five-point scoring system shown below; however, three- and seven-point systems are also common.
| Score | Meaning |
|---|---|
| +2 | Much better than the baseline |
| +1 | Moderately better that the baseline |
| 0 | Equivalent to the baseline |
| -1 | Moderately worse than the baseline |
| -2 | Much worse than the baseline |
Step 5: Score the alternatives
Now we score all of the evaluation criteria for each alternative. For example, the chocolate dip has a serving size of 60 g. It receives a score of zero since it is the baseline. Both the honey cruller and the Boston cream provide larger serving sizes (81 g) and receive a score of 1. The apple fritter is given a 2 for being substantially bigger than the chocolate dip (95 g).
We must perform similar evaluations for the remaining criteria. Once that process is completed, we can calculate a total score for each option by summing each criterion score multiplied by its criterion weight. The results can then be presented in matrix form as shown below.
| BASELINE: | OPTION 1: | OPTION 2: | OPTION 3: | ||
|---|---|---|---|---|---|
| Criteria | Weight | chocolate dip | honey cruller | Boston cream | apple friter |
| Cost | 3 | 0 | 0 | 0 | 0 |
| Serving size | 2 | 0 | 1 | 1 | 2 |
| Calories | 1 | 0 | -2 | -1 | -2 |
| Fat | 1 | 0 | -2 | 0 | -1 |
| Protein | 1 | 0 | -1 | 1 | 2 |
| TOTAL | 0 | -3 | 2 | 3 | |
The baseline always receives a total score of zero. The scores of the remaining options reveal their overall fitness relative to the baseline. For our example, the negative score of the honey cruller suggests that it is inferior choice to the chocolate dip. The positive scores of the Boston cream and apple fritter suggest that they are better alternatives, with the latter performing slightly better for our particular set of criteria and weights.
Step 6: Reflect on the results
While the Pugh Matrix is intended to assist in making an objective selection, we must recognize that there is some subjectivity inherent in its creation. As with any analysis, it is critical to reflect upon the answer rather than blindly accepting its validity.
In looking at our example, we notice that all the donuts have the same price. Including cost as a criterion has no effect on the outcome. A revised decision matrix might reasonably eliminate cost as an evaluation criterion; however, cost would remain a factor if other snack alternatives with different prices (e.g., cookies, muffins, bagels) were being considered.
We should also note that the outcome is sensitive to both the criteria we include and the importance we assign them. Incorporating the amount of carbohydrates in our analysis, for example, would have made the chocolate dip the better donut choice. Changes to the weighting system would also alter the overall rankings.
We must also ask ourselves whether the decision is a good one. If the final selection is unsound, the decision matrix may need to be modified to better consider all the relevant criteria. Such revisions may be helpful; however, there is also the risk that the process becomes biased to arrive at a pre-determined result. I must confess that I did exactly that in the example above — I really enjoy a good apple fritter! Therefore, it is important that we are able to justify the criteria we include in (or exclude from) our analysis, as well as the rankings of those criteria, on the basis of the problem we are attempting to solve. A different situation, with different priorities or constraints, could result in a different decision. The results may even change within a project as new information becomes available.
Conclusion
A Pugh matrix is a helpful tool for identifying the best alternatives when multiple factors must be be considered. While it can facilitate an objective evaluation of the options available, the outcome may be highly dependent on the details of its development. Both criteria and weights should be chosen carefully to reduce any potential bias.
Notes
- ^ We will use the American spelling donut, rather than doughnut, for consistency with the Tim Hortons nutritional guide. You can contact Tim Hortons if you wish to know why they do not use the Canadian spelling. Interestingly, the US celebrates National Donut Day on the first Friday in June, whereas Canada does not.
- ^ Some readers may see the use of nutritional information in selecting a donut as ironic. Know that you are welcome to create your own example on how to select the optimal pulse (e.g., beans, peas, lentils, or chickpeas?) using a Pugh Matrix. If you send me a link to your finished article, I’ll even include it in this post as a healthier alternative.